Be quality.
Your AI copilot for Windows apps.
JidoDebugger lets Claude, Cursor, Codex, GitHub Copilot, and other MCP-aware agents run, watch, and debug Windows desktop & CLI software on your machine — like a tireless pair-programmer that actually sees the screen.
Windows desktop apps and CLI tools — driven by an AI, running on your own machine, with the results actually shown back to you.
Connects to Claude, Cursor, Codex, GitHub Copilot, and any MCP-aware agent. A Windows-only AI copilot, on purpose.
Spin the write → run → fix loop at AI speed, in pair with the model you already use.
See it driving a real app
Watch JidoDebugger explore the stock Windows Calculator in blackbox mode — division by zero, square-root residue, overflow, and error recovery, all checked through UIA, with the AI even self-retracting a false positive after cross-checking with a WGC screen capture.
What it does
Four pillars, all designed for AI-driven QA on Windows.
MCP integration
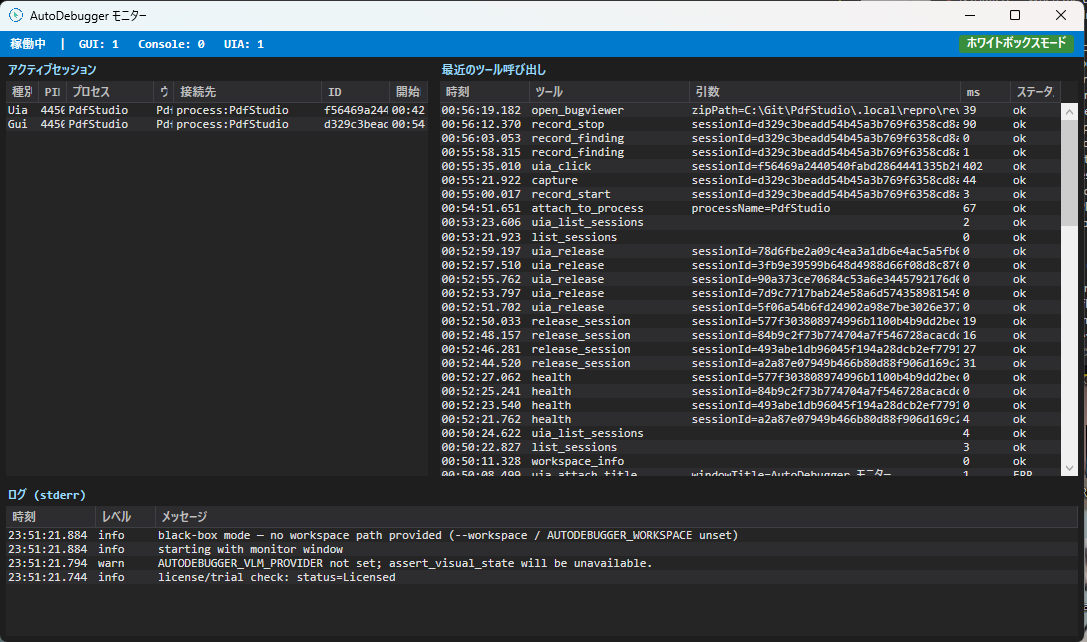
First-class MCP server. 45+ tools your agent can call: capture screenshots, query UIA trees, click, type, record findings as xUnit/NUnit/MSTest stubs.
UI Automation (UIA)
Find, click, type, drag, wait — by AutomationId, name, or live tree survey. Resilient to layout changes, with concrete recovery hints when something drifts.
Crash & perf analysis
Crash watch, FPS sampling, resource & VRAM sampling, a11y audit, visual baselines. Closes the loop from “something feels off” to a reproducible finding.
Distributed grid (preview)
Bring-your-own-device and bring-your-own-cloud patterns. Run tests across a fleet of real Windows machines from one MCP endpoint. No vendor pool, no surprise bill.
Real debugging, real apps
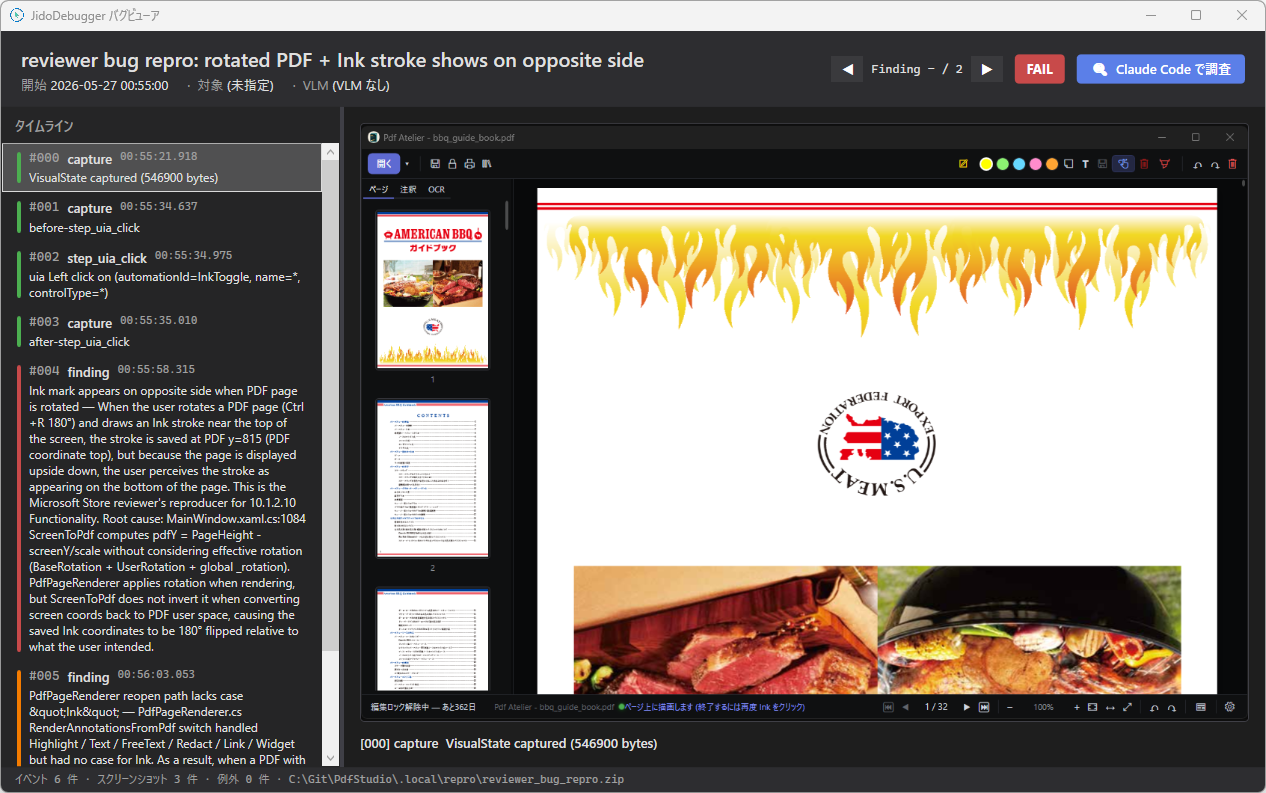
Live captures from a Microsoft Store reviewer's reject — reproduced, root-caused, and exported as a repro.zip in one closed-loop jidodebugger session.
Free for the first 500. First-year discount for early adopters.
Until dhq-boiler becomes a registered company, JidoDebugger is fully free for the first 500 users — individuals and small teams included.
- Refresh token auto-renews while online
- Up to 7 days offline grace
- MCP + GUI Monitor + BugViewer
- 5-language UI (en / ja / zh-CN / zh-TW / ko)
- Refresh token auto-renews while online
- Up to 30 days offline grace
- CLI installer & silent deploy (Intune / SCCM / Ansible)
- Distributed grid (BYOD / BYOC) ready
Get your free license
The installer is free to download — no registration needed. The license file (license.dat) required to run it is issued after email verification. If a free slot is open, you’ll receive a license link right away. If not, you’ll join the waitlist and we’ll let you know the moment a seat frees up.